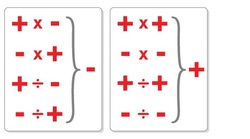
This is a picture of the negative and positive number chart. It says what the problem would equal if the numbers you were using were negative and positive. This chart is only for division and multiplication. The rules of negative and positive multiplication and division are that the bigger number will always be the answers negative or positive.

This is a picture of dice game that you can play with your classmates and friends. You can play this game by rolling the dice and adding what you got on the positive dice (green) and what you got on the negative dice (red). After that you roll about 10 times and add what you got for all them combine. Whoever gets the lowest score you WIN.
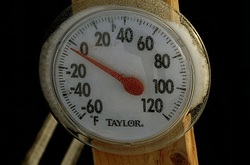
You probably use negative and positive numbers everyday, but you probably don't notice. You can use negative and positive numbers in things like temperature reading, getting a GPA, and math class of course. For example if Mary goes outside at 8am and its -20 degrees outside. At 1pm she goes outside and the temperature is -2 degrees. How much does the temperature rasie in the 5 hour time period?
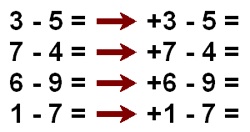
This is a picture of KCO. If you don't now what KCO means it means it means Keep Change Opposite. I used the first one and changed it to addition. This means that the problem now is 3 + -5. That way it is a addition now.

This is a picture of alot of blank spots. This can be used for neagative and postive numbers when you need to. This is a picture of neagtives plus neagtive equalling a neagative. This is a picture of -4 + -3 = -7 .

This is a picture of a a number line. It is another way to add or subtract negative and positive numbers visually. This picture explains -5 + 2 = -3. This can make problems easier for visually learners.
